When using an FPGA for wireless communication or signal processing, generally follow these steps:
(1) Simulation of floating point algorithm using matlab
(2) Convert matlab floating-point algorithm to fixed-point algorithm, simulate and compare with the performance of floating-point algorithm
(3) If the performance of the fixed-point algorithm reaches the requirement, the implementation of the fixed-point algorithm can be performed on the FPGA.
(4) After the FPGA implements the fixed-point algorithm, the performance of the FPGA-implemented algorithm should be compared with the matlab simulation to determine whether the requirements are met.
The fourth step requires a comparison between FPGA and Matlab simulation. If the simulation results of the FPGA are compared with the Matlab simulation results, the data generated by the Modelsim simulation can be written to the file, and then the data in the file is read out in Matlab for simulation comparison.
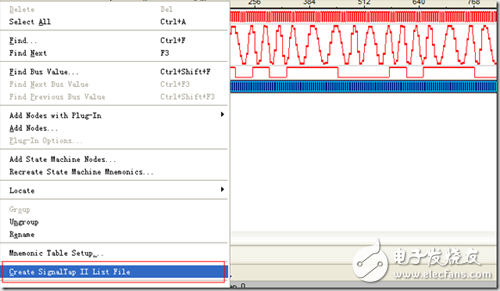
Then if you want to compare the FPGA implementation results with Matlab simulation results more realistically, you can use Signal Tap II to collect the data generated by the FPGA internal processing online, then right click in the Signal Tap II window and select the create signalTap II list File command. As shown below.
After doing this, a file is generated. The following is a block of data from the file, as shown below:
Signal Legend:
Key Signal Name
0 = ad_clk
1 = ad_data
2 = rx:rx_inst|rx_demsk:rx_demsk_inst|compare_decesion:compare_decesion|data_out
3 = rx:rx_inst|rx_demsk:rx_demsk_inst|FIR_LPF_16:FIR_LPF_16_INST|data_out
Data Table:
Signals-> 0 1 2 3
Sample
-256 0 2604 0 -7024719322
-255 1 2604 0 -7024719322
-254 1 2604 0 -8128737870
-253 1 421 0 -8128737870
-252 0 421 0 -8128737870
-251 0 421 0 -8128737870
-250 1 421 0 -8128737870
-249 1 421 0 -8813966451
-248 1 4 0 -8813966451
-247 0 4 0 –8813966451
......
The following can be used to read these data using matlab, in order to facilitate the reading of matlab, we can delete the contents of the signal name and other information, only retain the data behind the sample.
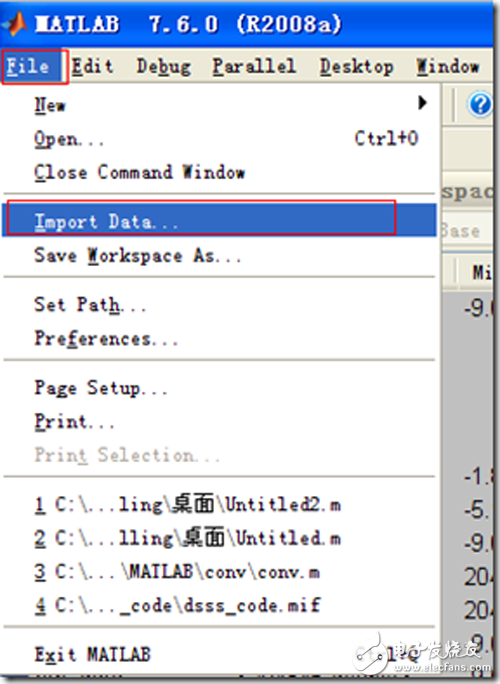
Then open matlab and select the File –> import data command as shown below:
Select the data file just now, the following dialog box will appear:
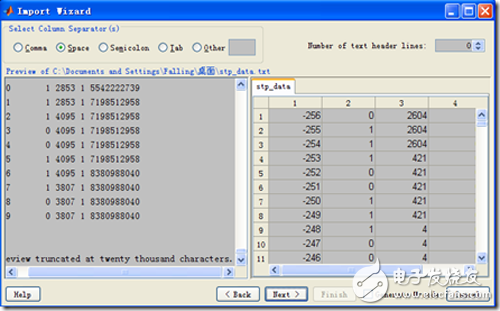
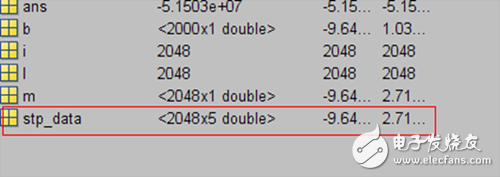
You can see that matlab stores the data in the data file as a matrix. The name of the matrix is ​​the name saved in the data file. At this point you can see this data in Workspace, as shown below:
So we can use this data to simulate in Matlab. If you want to read the data in the fifth column of this matrix, you can use the following command:
Data5 = stp_data(:,5);
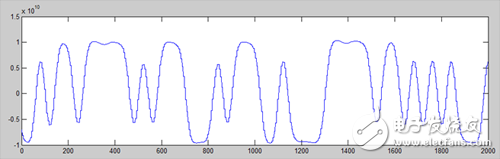
Here, data5 can be processed. The following figure directly reads the data collected by signaltap II and displays it in Matlab:
In addition, in addition to the GUI operation to read data, matlab also provides a response function textread, you can use the following command to read the data:
[a1,a2,a3,a4,a5]=textread('stp_data.txt', '%d%d%d%d%d')
In this way, the data in stp_data.txt can be read in. For details on how to use textread, please refer to Matlab's help.
A home projector that supports WiFi connection, usually an Android system, can connect to the same WiFi to realize screen sharing. In addition to multimedia functions, you can also watch videos, download software and play games online. Mainly focusing on high-quality goods, the projection screen is clear and true, suitable for home, office, teaching, and entertainment
wifi mini home projector,wifi protable home projector,bluetooth mini projector,HD mini projector
Shenzhen Happybate Trading Co.,LTD , https://www.happybateprojector.com